


Latest ICNARC graphs: amongst general reattribution of other illness to Covid-19, pneumonia from flu is a thing of the past
Because there is no high profile opposition to the UK Government and its economic blockade in the alternative media and fringe corporate-media that isn’t controlled, in the winter of 2021 we are seeing the very same psychological operation being executed as was in March 2020.
And although experience teaches, therefore, that it would appear to be pointless producing an article that thoroughly demolishes the propaganda, because the British population, being as cabbage-headed as it is, generally won’t take any notice of information unless it is disseminated to them by a UK Government operation, whether it appears to be that sort of thing or not, the point of being an FBEL reader is to have knowledge whereby one can survive and thrive; thus here is another foray into a topic that should have been nipped in the bud in April of last year.
For background, the reader might want to (re)acquaint himself with Covid-19 in a Nutshell (link); in any case, here is a quick reminder that Covid-19 is a pneumonia caused by SARS-COV to ACE2 binding at the lung†, and unless one has had this type of illness before they succumbed to it, they did not die of Covid-19. Therefore, the death numbers that the UK Government and its agents publish do not reflect reality because they involve the inclusion of all sorts of terminations from other causes attributed to Covid-19. At FBEL, this is called “Covid-19” – notice the quotation marks.
Moreover, from the author’s research (please read the FBEL article, Covid-19 Is Not Flu – link), it would seem that the acute form of Covid-19 is the only form of Covid-19. A Covid-19 case is generally, and perhaps always one that would need critical care. There is no mild version. There is no asymptomatic carrying and spreading. SARS-COV (because Covid-19 is SARS) enters the body via the respiratory tract, and if the host is (or becomes) susceptible – and this is more important than “catching” the virus – there will be infection at the lung. It’s a rare disease. SARS [i.e. Covid-19] was – is – a rare disease.
At FBEL, it’s always been held that admissions to critical care units, and then subsequent deaths, are the best way of understanding the scale and impact of Covid-19. However, it was not readily understood to what extent ICUs were treating people merely deemed Covid-19 patients, who had actually had another illness reattributed to the disease, in the same way as the general British medical-industrial complex was operating.
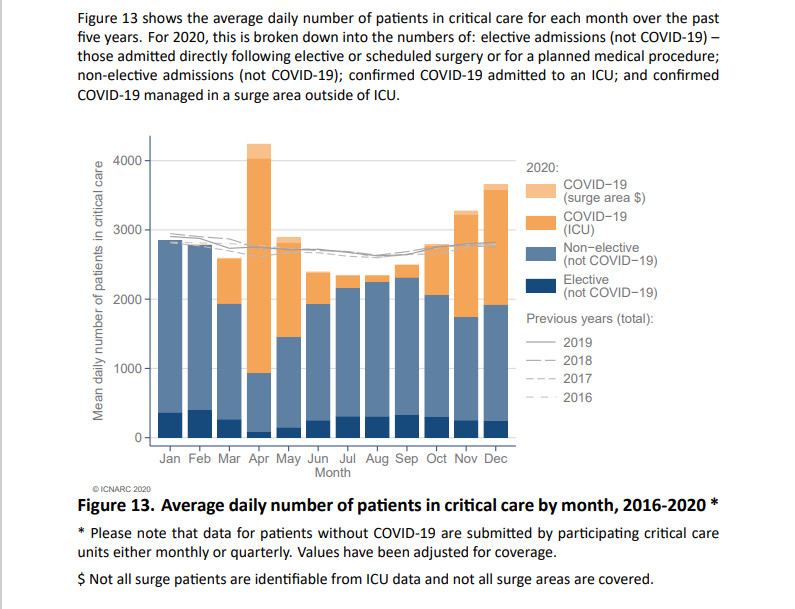
Fortunately, ICNARC, which won’t need introducing to the regular FBEL audience (so if you are new, reader, please ask your usual alternative media to explain why they’ve never mentioned the organisation), is now producing graphs that suggest that ICU figures are skewed to overstating the size of the problem. Below are a number of graphs taken from the most recent ICNARC report (8th January, 2021).
The first of these graphical illustrations (figure 13) show that admissions to ICUs in England, Wales and Northern Ireland were only unusual in one month (April) in the spring and summer of 2020: so much for a Covid-19 pandemic. The same graph also shows the numbers of ICU admissions being larger in November and December in 2020 than they were in four previous years. It would appear that the difference is explained by additional Covid-19 cases. However, other graphs from the same data set suggest that a good deal of these have been other illness and cause for admission that have been reattributed to Covid-19, either in ignorance (because zealots in the NHS are not bright), or more likely deliberately and politically (because they are zealots).
In the graphs in figures 14 to 17, the reader will note a number of identical features. First of all, ICU admissions are generally below that of four previous years. Secondly, there is a dramatic trough in April at the same time when ICU admissions for Covid-19 peak. Also, from September and October, mirroring the start of an increase in Covid-19 admissions at that time, the numbers trail off.
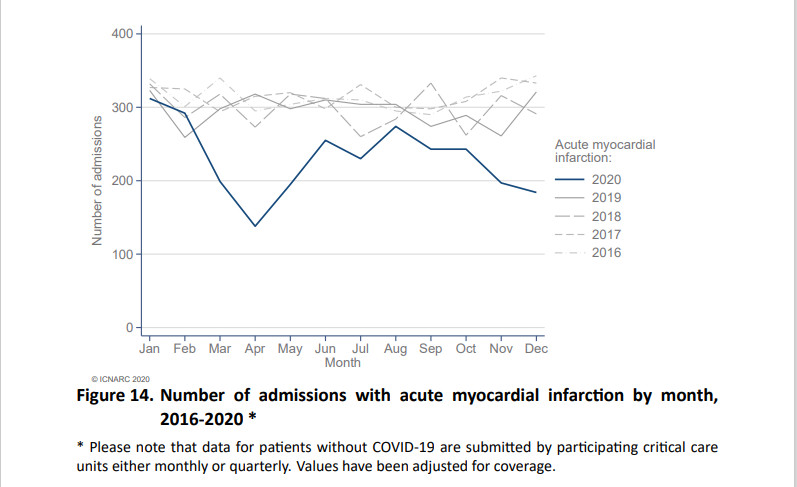
To make comments about particular graphs, the one in figure 14 is very interesting, because it is clear that the NHS regards Covid-19 to be a disease of the heart, when it is not. Note that 2020 admission numbers for acute myocardial infarction leaves the general band occupied by all the other years at the start of the Covid-19 episode in February/March, and then never rejoins. The author suggests that there has been permanent reattribution of particular heart illness to Covid-19 (and that there will only ever be a recovery to normal after the criminality of doing it has been recognised).

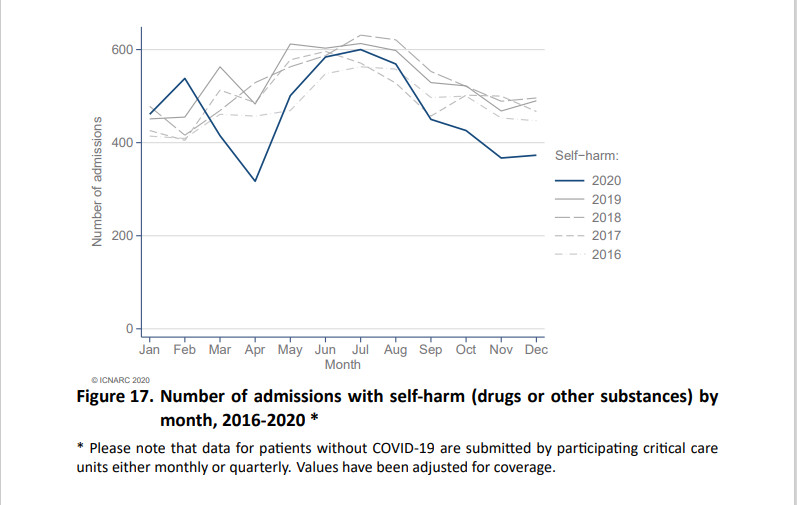
The graphs in figures 15 and 17, which show patients being admitted with strokes and through self-harm respectively, suggest that hospitals have been very calculating in the reattribution of this other illness to Covid-19. We can say this because the line of these cases for 2020 stays in the band of usual numbers except when there is the spike (April) or gradual growth (from September) in Covid-19. It suggests that hospitals know that they shouldn’t be able to plausibly reattribute these causes of ICU admission to Covid-19, but maliciously do reattribute them when UK Government absolutely requires the appearance of a crisis.
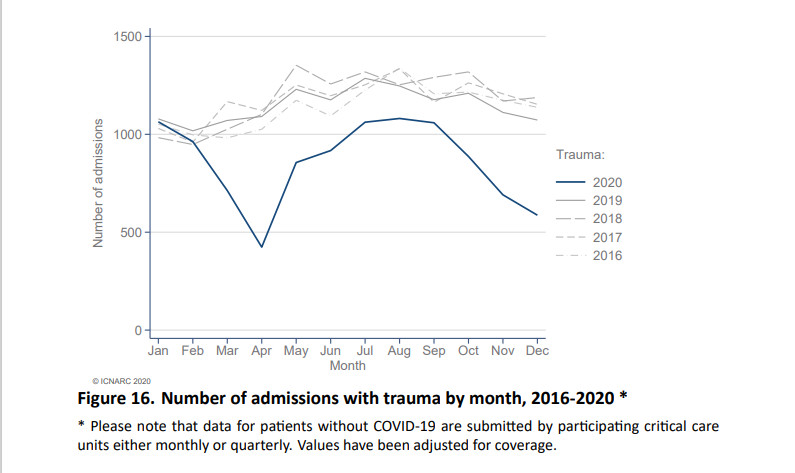
There are two very interesting graphs in figures 16 and 18. To deal with the former first, it shows the 2020 line for admissions with trauma behaving in a similar way to those with acute myocardial infarction. In this graph we see the definite political reattribution in April and September/October, but also a general possible reattribution throughout the year. The author suggests that a lot of this could be explained by trauma leading to immune system overreaction, and where this is involved, the NHS will feel happy to call the illness Covid-19.
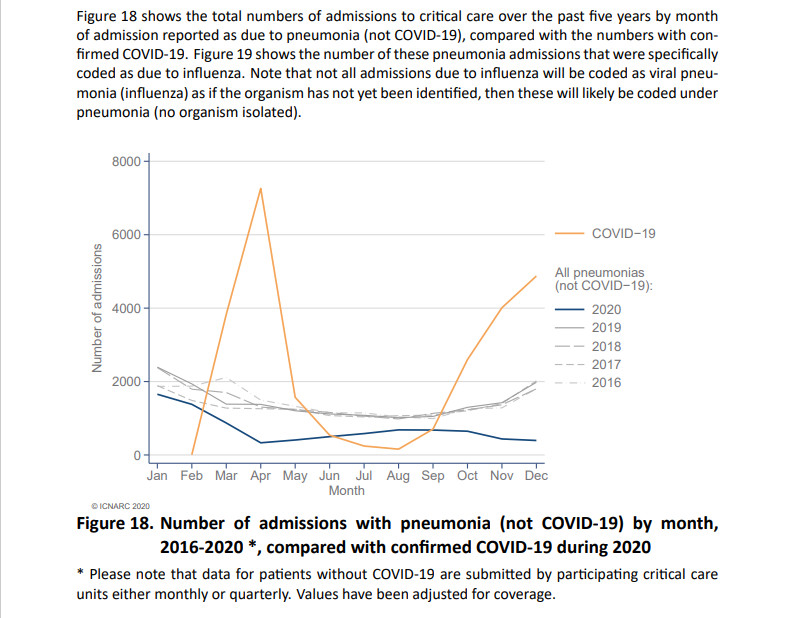
Figure 18 gives us a clue that this is happening. It suggests that anything that the NHS can get away with calling pneumonia, will finally get called Covid-19. It also suggests that most cases of pneumonia are being reattributed to Covid-19.
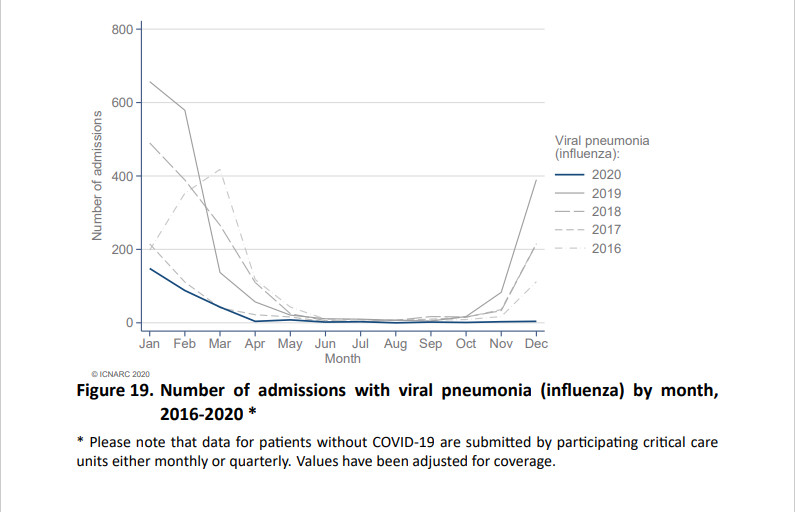
Figure 19 is the most interesting graph of all because it shows that ICU admissions for patients with pneumonia leading from flu bumping along all year after April at, or just above, zero. This condition, it would seem, has gone the same way as polio, but more so, and is apparently a thing of the past.
Utter horse manure, of course, and there is no other image than the one presented below to better represent the criminal activity that has been taking place in the corridors and wards of the nation’s supposedly beloved NHS.
For the record, ICNARC reports that from September 1st, 2020 to January 8th, 2021, there have been 12,115 Covid-19 patients admitted to ICUs in England, Wales and Northern Ireland. 9059 outcomes are known, and of these 3415 people have died, 5644 have been discharged, and 3056 were still receiving critical care. We can be certain that 3415 people – even this few – did not die of real Covid-19.
“Only following orders” is not going to cut the mustard: Building The “Coronahoax” Charge Sheet: Reckoning Culpability For The Deliberate Inflation Of Covid-19 Death (link).
Update, 20/01/21: Always happy to help a reader who attempts the research himself first before asking, so: ICNARC publishes reports weekly on this page:
You’ll find the current one in the right hand column; it’s for the 15th January. It looks to have the same graphs, albeit differently numbered. If there’s an archive on the site, then you’ll please have to find it yourself; the author has been collecting these reports for nearly a year and hopefully doesn’t require it. The report upon which this article is based can be viewed here:
ICNARC_COVID-19_Report_2021-01-08.pdf
† Update, 26/01/21: This truth was not challenged by Michael Yeadon, ex-Pfizer head of respiratory research, when it was put to him on Twitter. The author posted the following reply to a tweet in which Yeadon claimed to have had had a mild case of Covid-19:
SARS-COV binding with ACE2 at the lung – how do you know you had a “mild” bout of that?
Yeadon did not respond. This is perhaps not to be wondered at. As previously discussed hereabouts, the information is strictly not supposed to become common knowledge.


Great analysis as always, thank you. My OH is wondering if “cabbage-headed” is a reference to this old SCTV sketch?
https://www.youtube.com/watch?v=iI3iLQ-qDqc
Hi,
Can I please ask where you located these very revealing graphs as I could not find any 2020 data on the ICNARC website. Much appreciated.
See update.